How to use these infographics
All ten infographics on this page are free to use under Creative Commons Attribution 4.0 (CC BY 4.0). You can:
- Embed them in articles, blog posts, or social media.
- Use them in lectures, presentations, training materials, or staff briefings.
- Reproduce them in print materials, including treatment-service brochures.
- Translate or adapt them, as long as you credit the original.
We ask only that you include a credit line — for example: "Source: Relapse.com.au, relapse.com.au/research" — and link back to this page where reasonable. If you use them in a publication or paid product, we would love to hear about it.
A note on the data
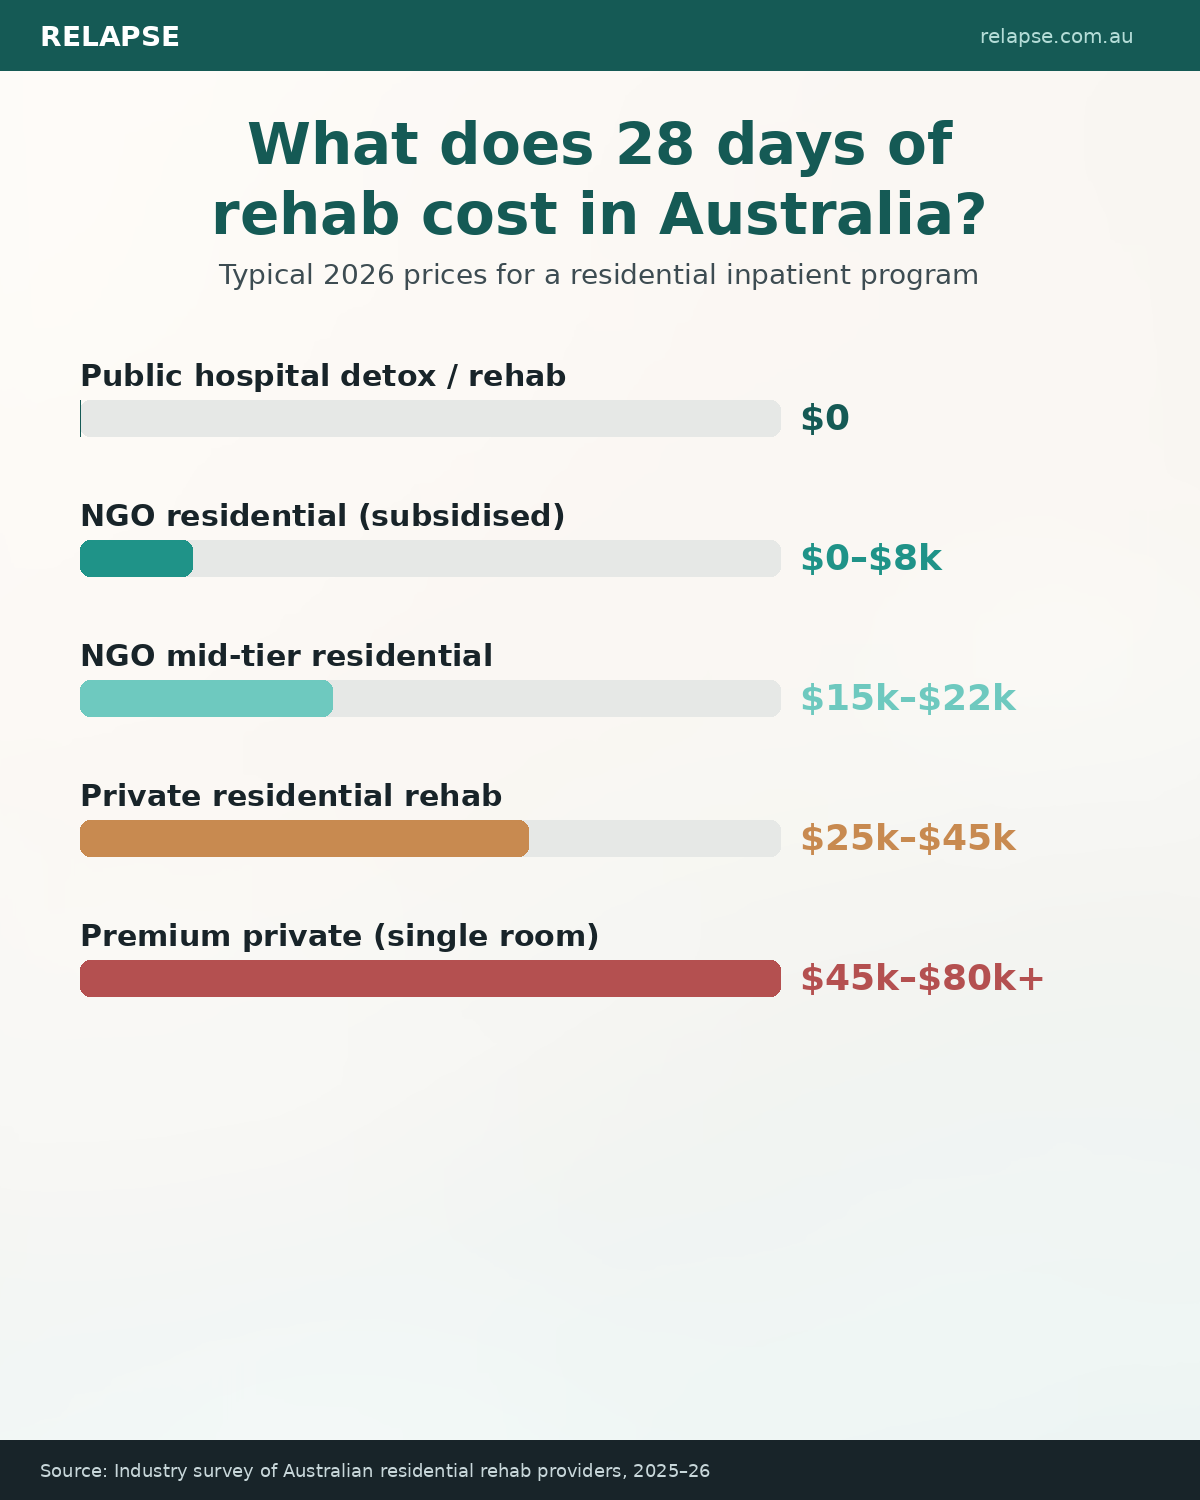
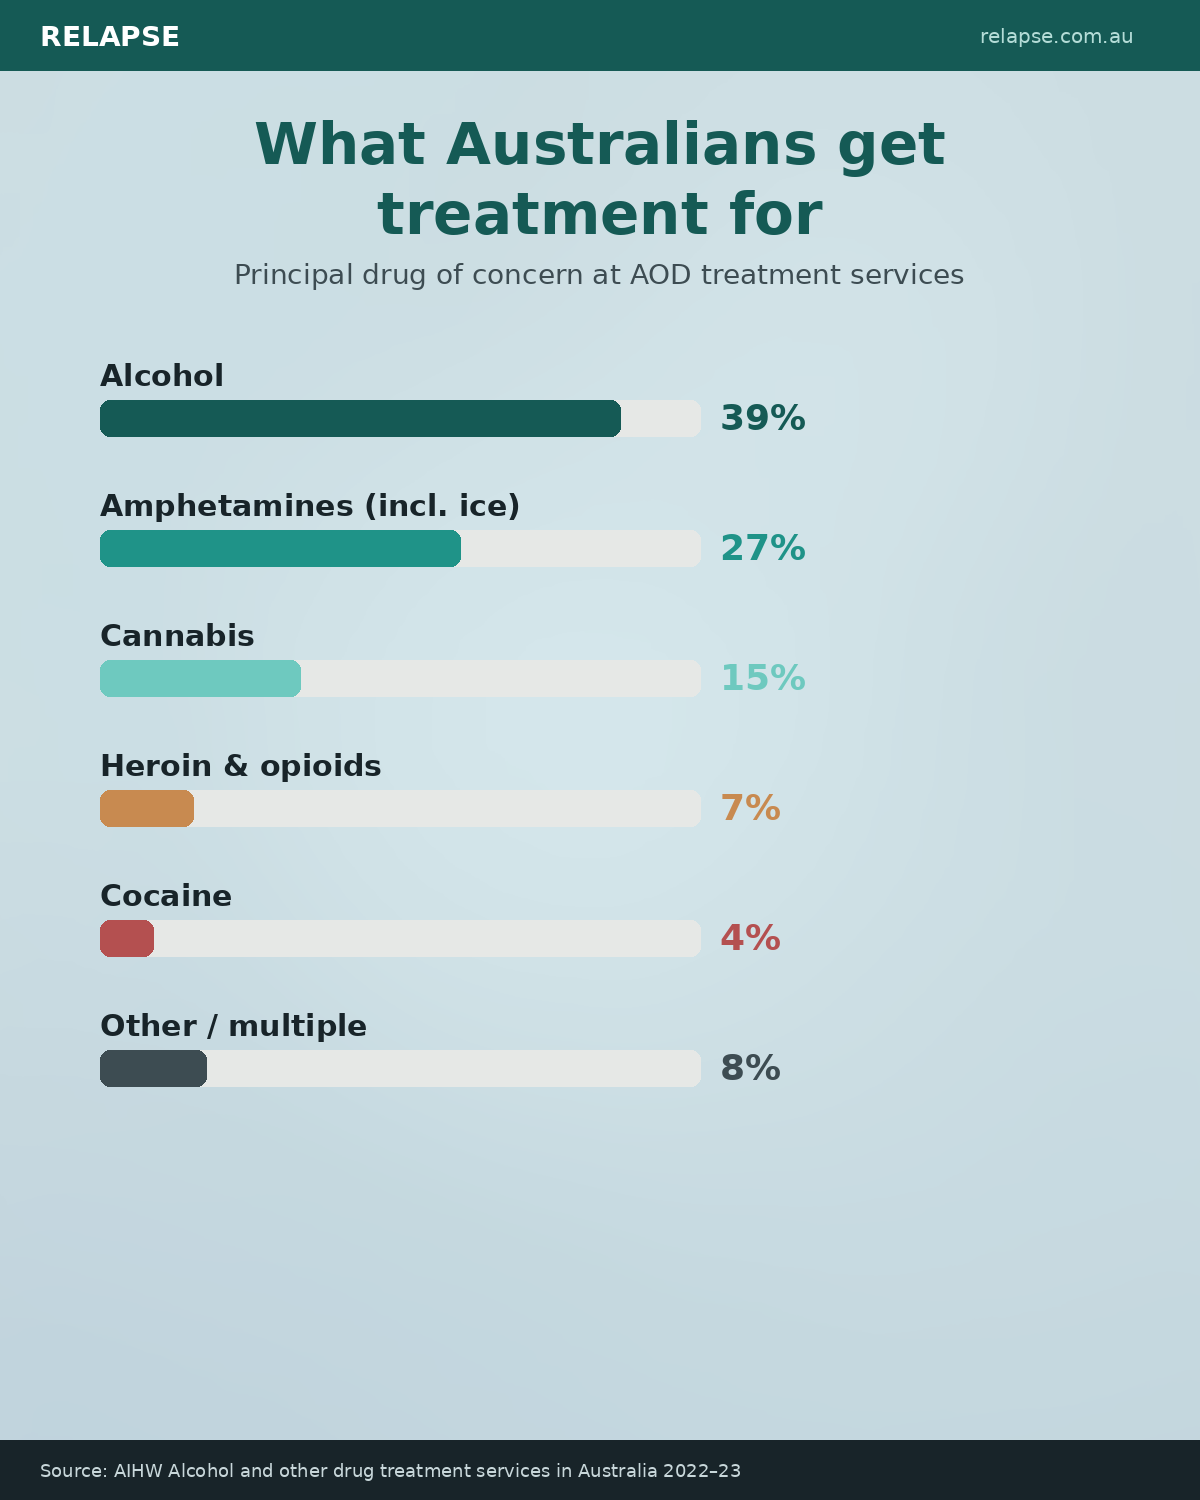
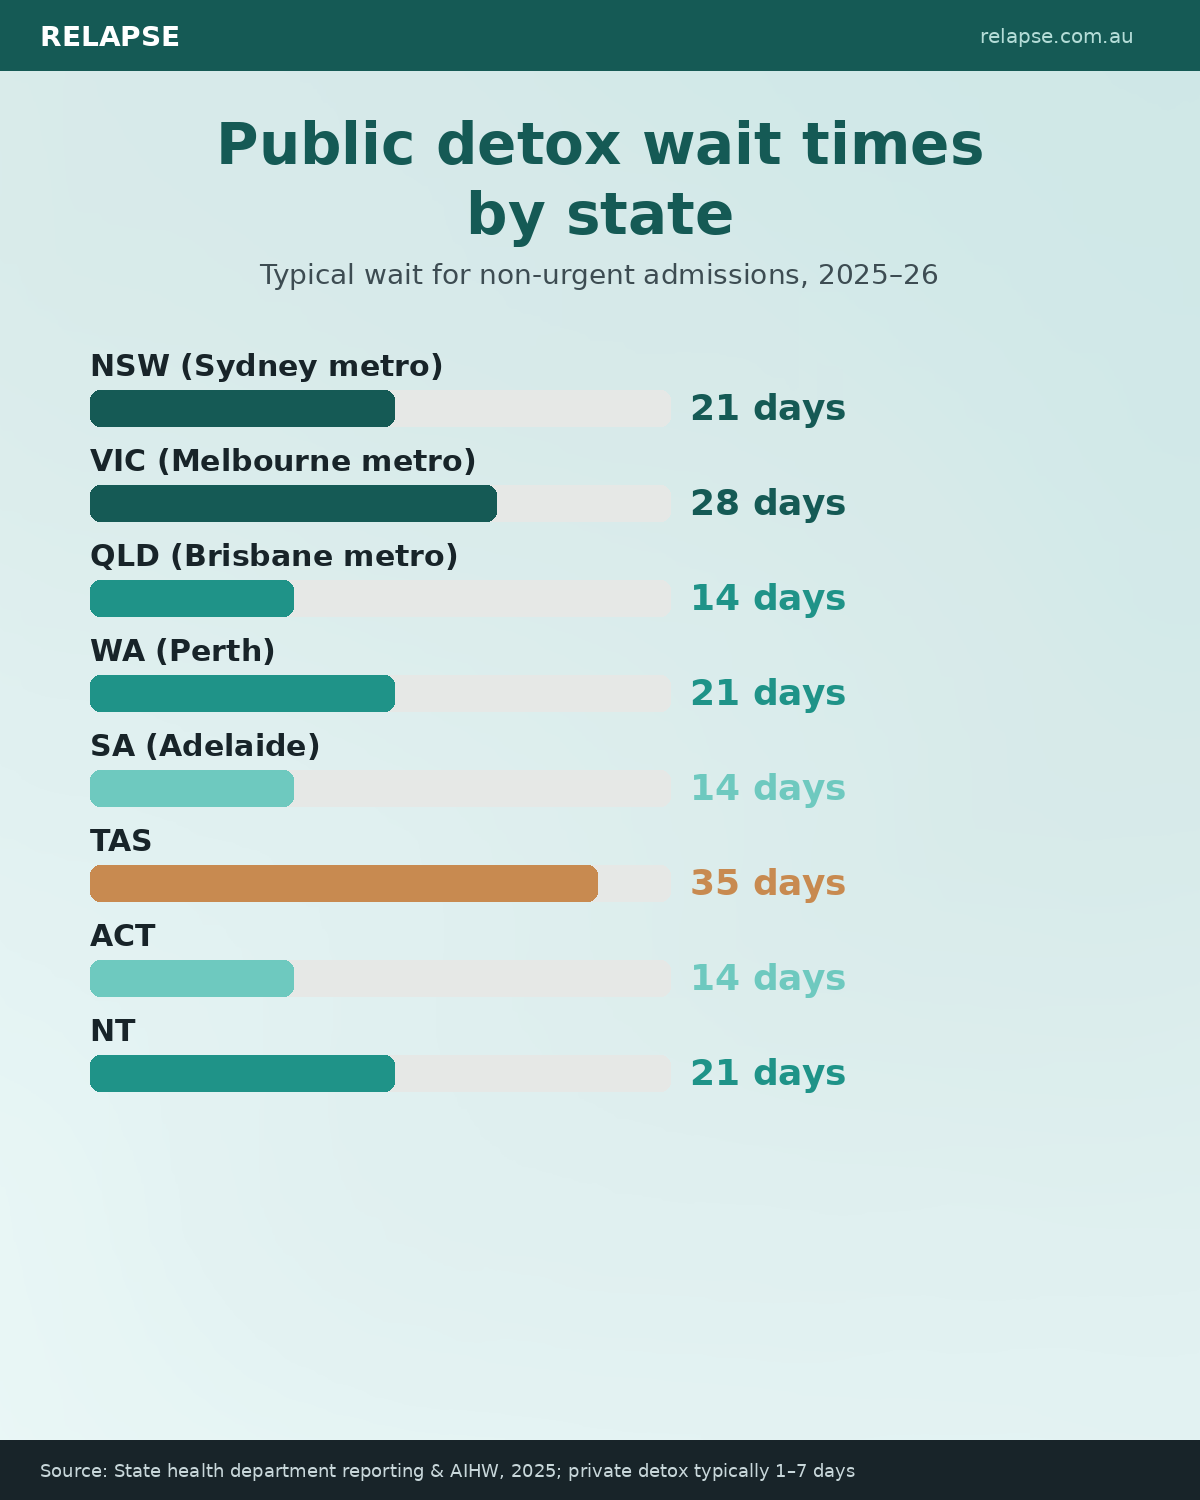
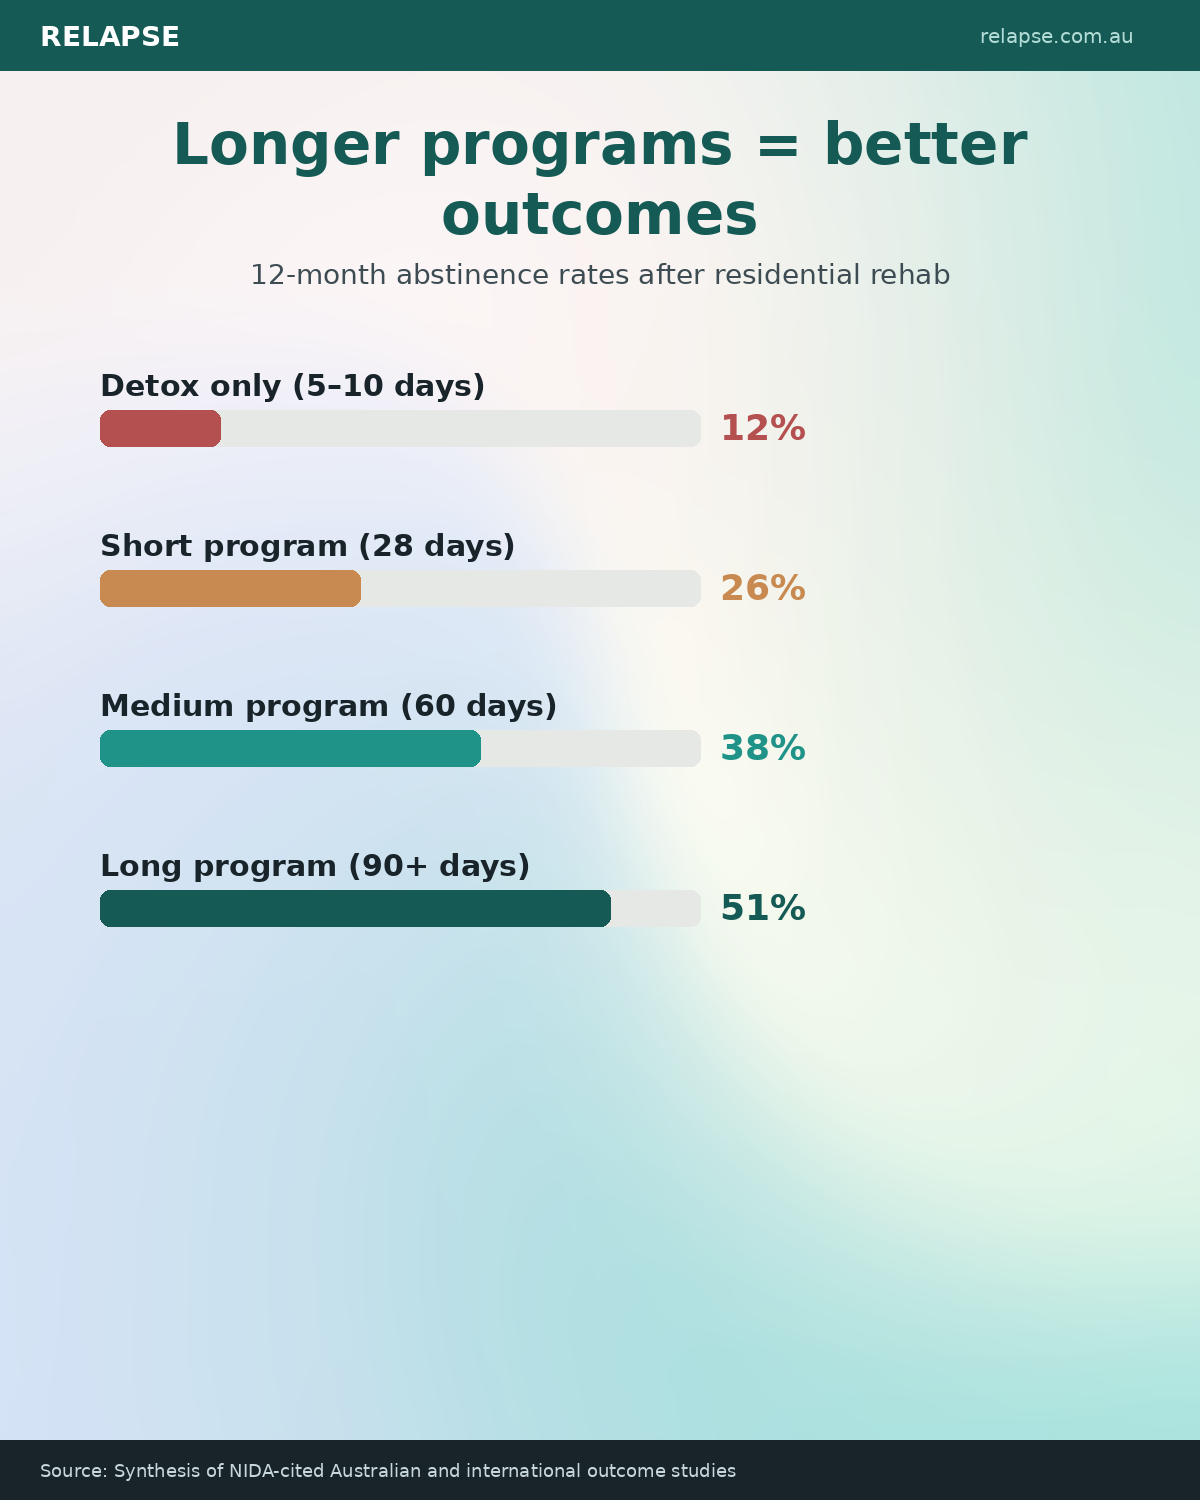
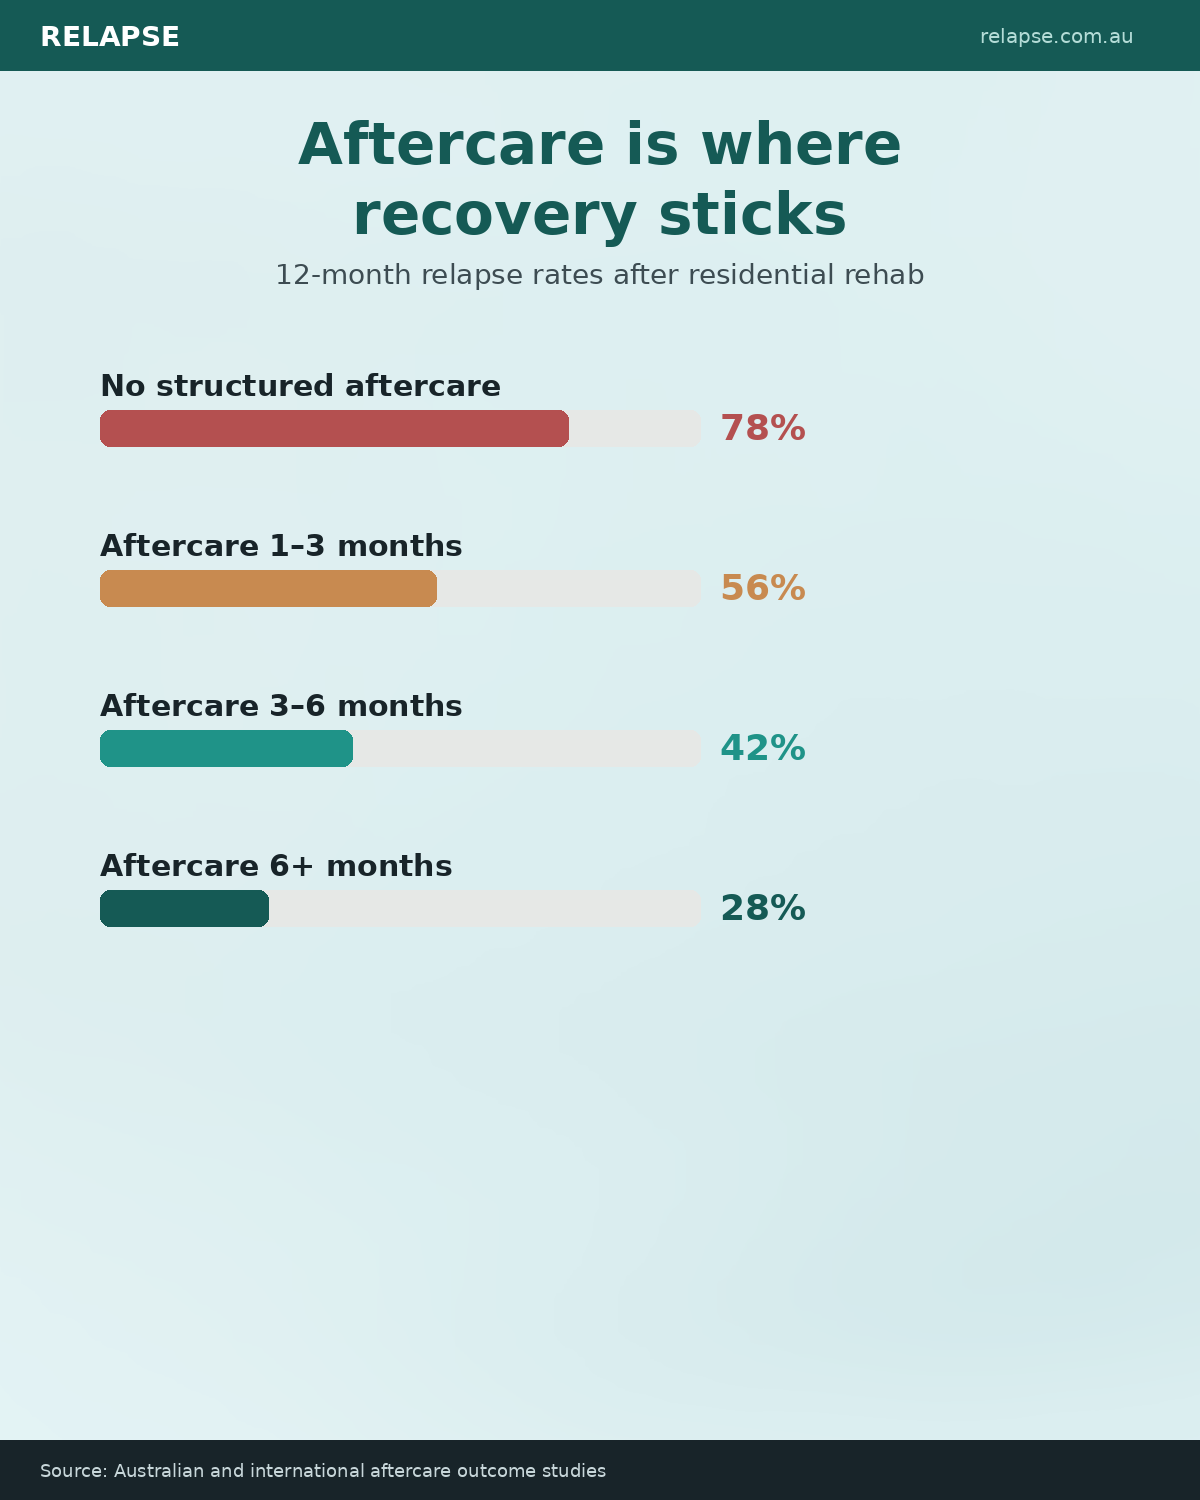
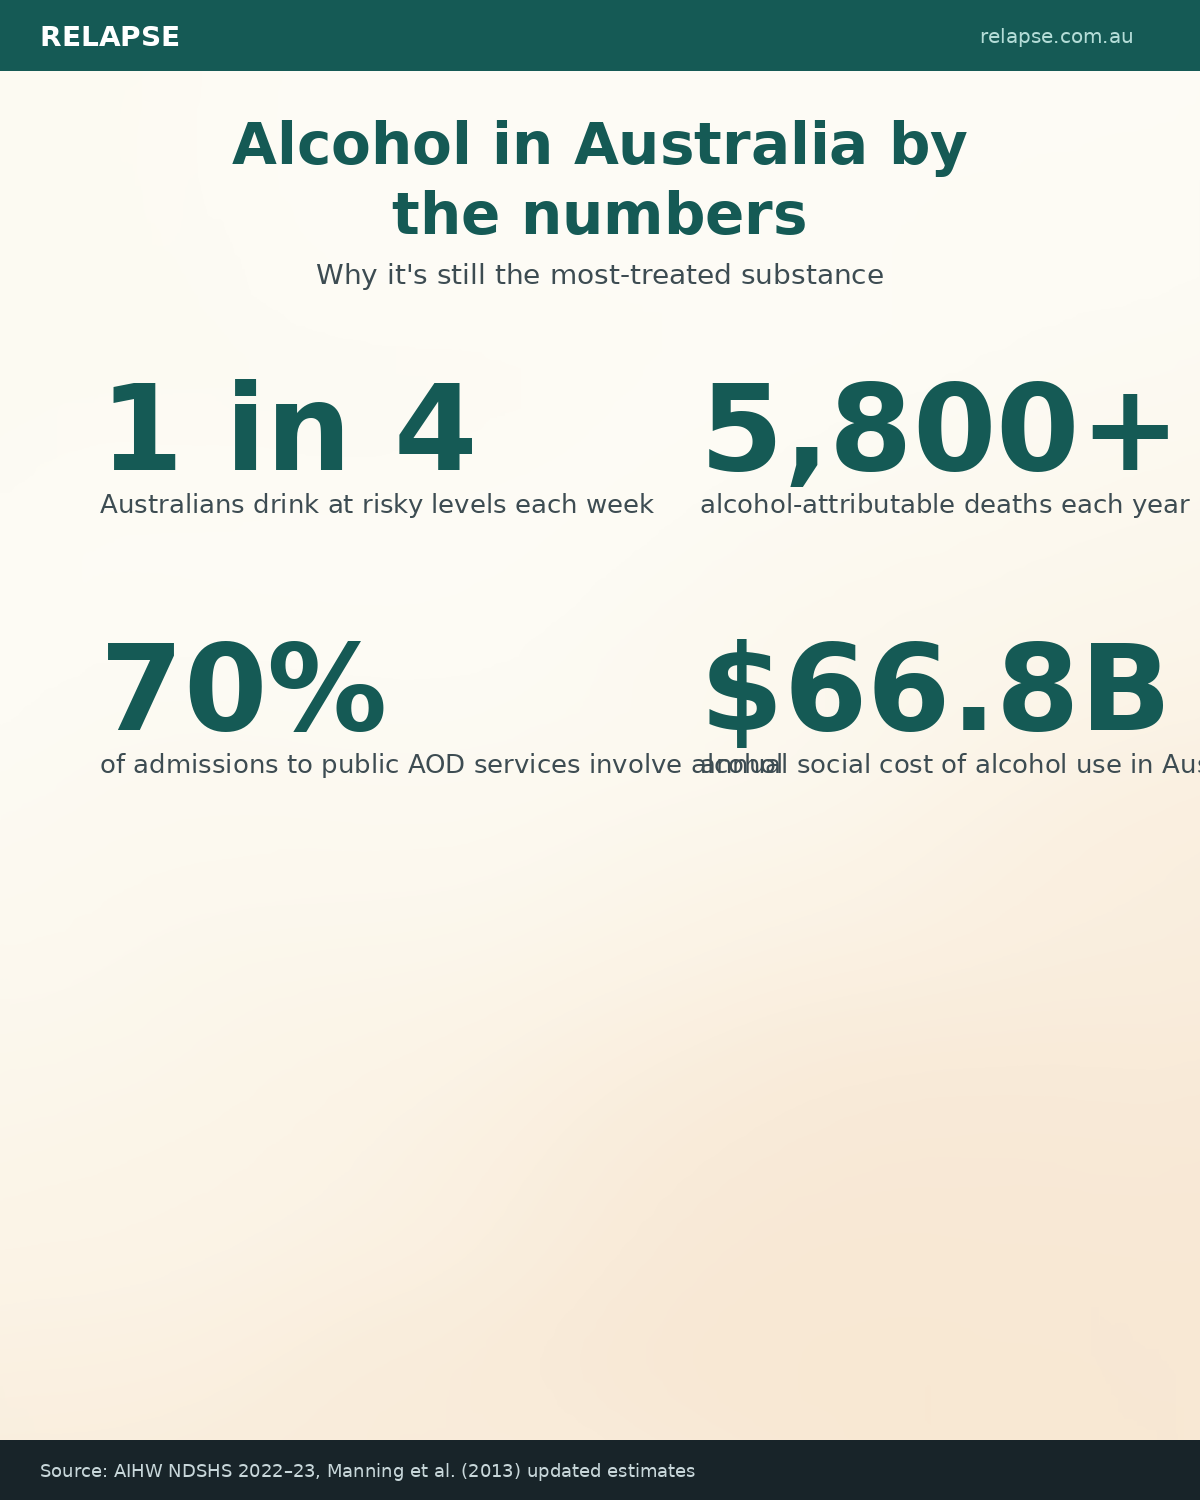
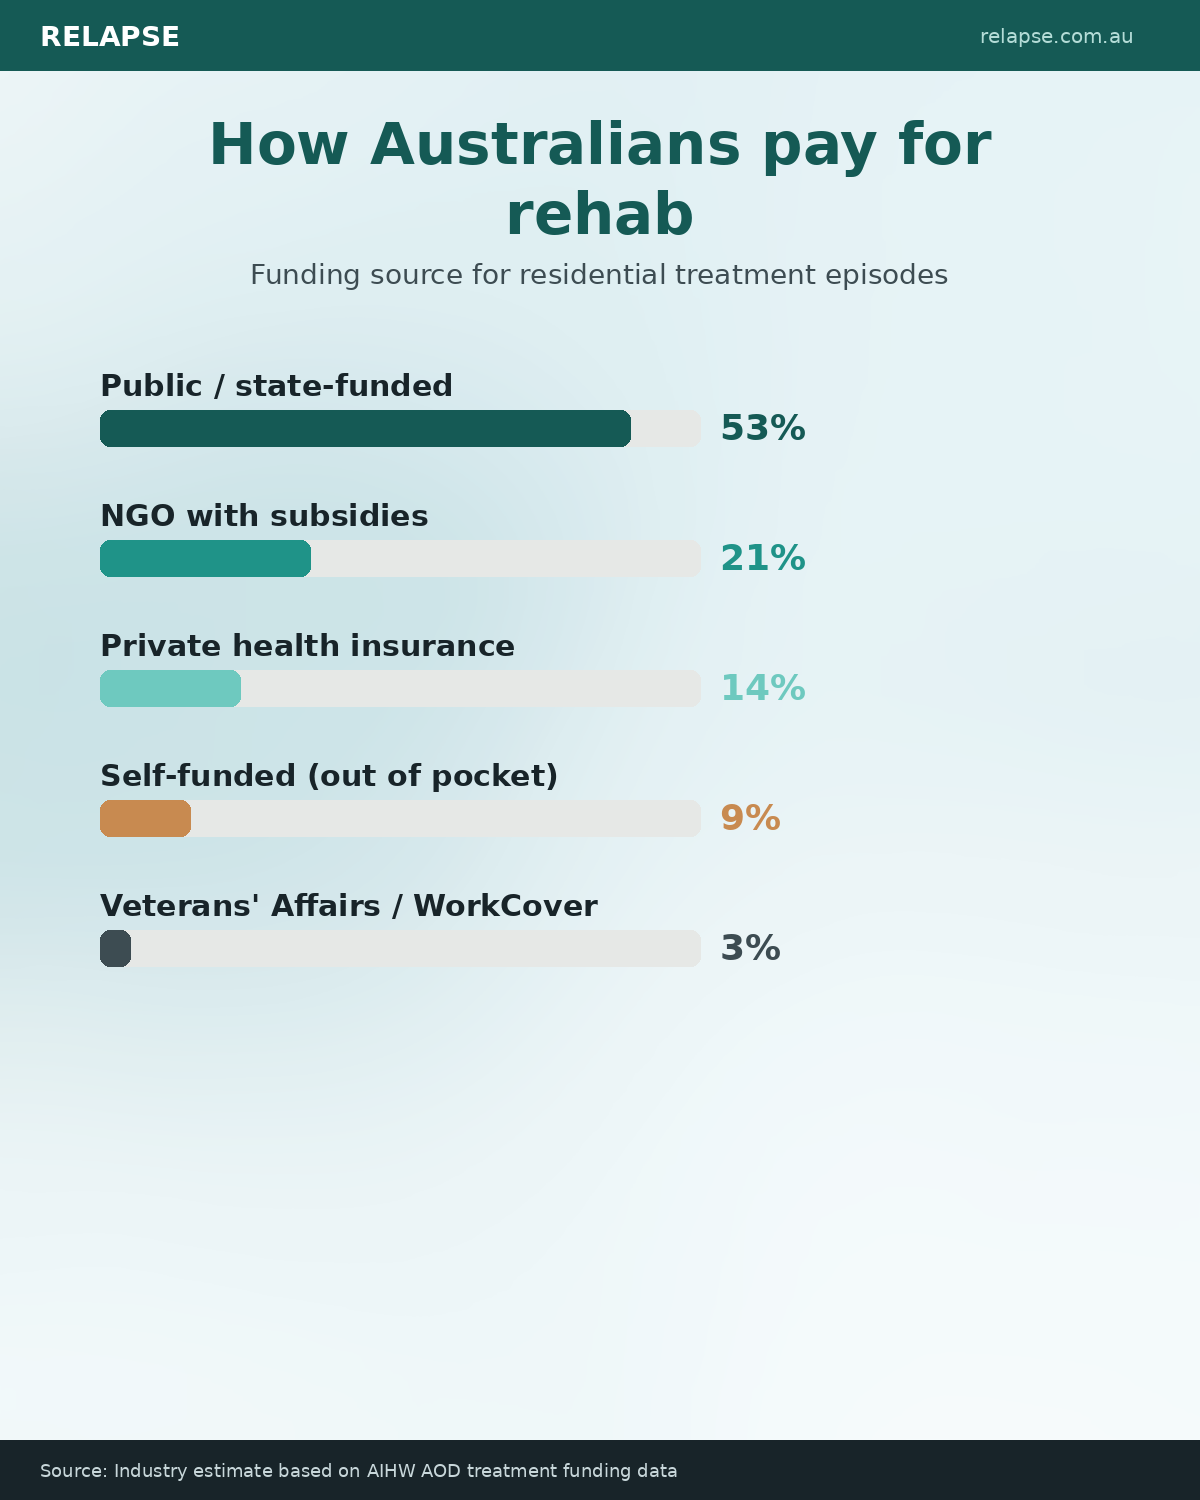
Infographics on this page synthesise public data from the Australian Institute of Health and Welfare (AIHW), the Australian Bureau of Statistics (ABS), the National Drug and Alcohol Research Centre (NDARC), state health department reporting, and peer-reviewed Australian outcome studies. Where industry data is used (rehab pricing, funding mix), we say so on the relevant graphic.
Recovery is individual and the numbers above describe populations, not people. If you or someone close to you is wrestling with the figures on these graphics, the practical next step is a free, confidential conversation — request a callback below or call your state line directly.
Suggested citation
For academic, journalistic, or professional use, please cite as: Relapse.com.au (2026). Australian rehab data and research. Retrieved from https://relapse.com.au/research/.
Specific infographics can be cited individually — each PNG includes a source line at the bottom of the image. If you need higher-resolution versions, vector files, or translations into another language, email [email protected] and we will prioritise the request.
Why we make these free
Australian addiction recovery is poorly served by good public-facing data. Most of what is available is buried in PDF reports written for clinicians and policy-makers rather than the people making decisions about their own treatment or that of someone they love. The infographics on this page are an attempt to close that gap by translating the most important numbers into formats that journalists, peak bodies, treatment providers, GP practices, and educators can use directly.
We benefit from the visibility — every embed includes a credit link back to Relapse.com.au — but the primary motivation is honest: better public understanding of how Australian rehab actually works, what it costs, and what predicts long-term recovery is good for everyone in the field, including us.